
Ethereum Price Crashes Below $2,000: How Low Can ETH Go?

0
0

Red candles everywhere. $Ethereum slipped below the $2,000 mark on Friday, November 13, 2026, for the first time since August. ETH tagged an intraday low of $1,894 on Bitstamp before buyers pushed it back toward $1,958, but the damage is done: the second-largest crypto is down more than 20% in a month, and its daily RSI just dropped into oversold territory.
So is this the bottom, or just a pause before the next leg down? We looked at the ETH charts on three timeframes to map the support levels, the rebound targets and the scenarios that matter for the days ahead.
Why Is Ethereum Crashing Today?
There is no single trigger behind the Ethereum crash. Several pressures are hitting at the same time:
- Hot inflation, hawkish Fed: October CPI came in at 0.4% against a 0.3% consensus. Instead of rate cuts, markets now price roughly 85% odds of a quarter-point Fed hike in December, according to CME FedWatch. The US dollar index climbed above 103, its highest level since April 2025.
- Ethereum ETF outflows: US spot Ether ETFs have bled money in every session since November 5. Six straight days of redemptions add up to roughly $532 million, according to Farside Investors data, with BlackRock's ETHA alone losing almost $130 million on November 11.
- Leverage flush: CoinGlass counted around $1.65 billion in crypto liquidations over 24 hours, close to 89% of them longs. Ethereum alone accounted for roughly $288 million. It is the second billion-dollar wipeout in eight days.
- Bitcoin dragging everything down: $Bitcoin fell under $70,000 and touched its weakest level since mid-August, pulling the whole altcoin market with it.
Not everyone is running for the exit, though. On-chain trackers spotted a whale wallet scooping up 10,380 ETH (about $20 million) during the dip. For the bigger picture, read our breakdown of why crypto is crashing.
How Bad Is the Ethereum Crash So Far?
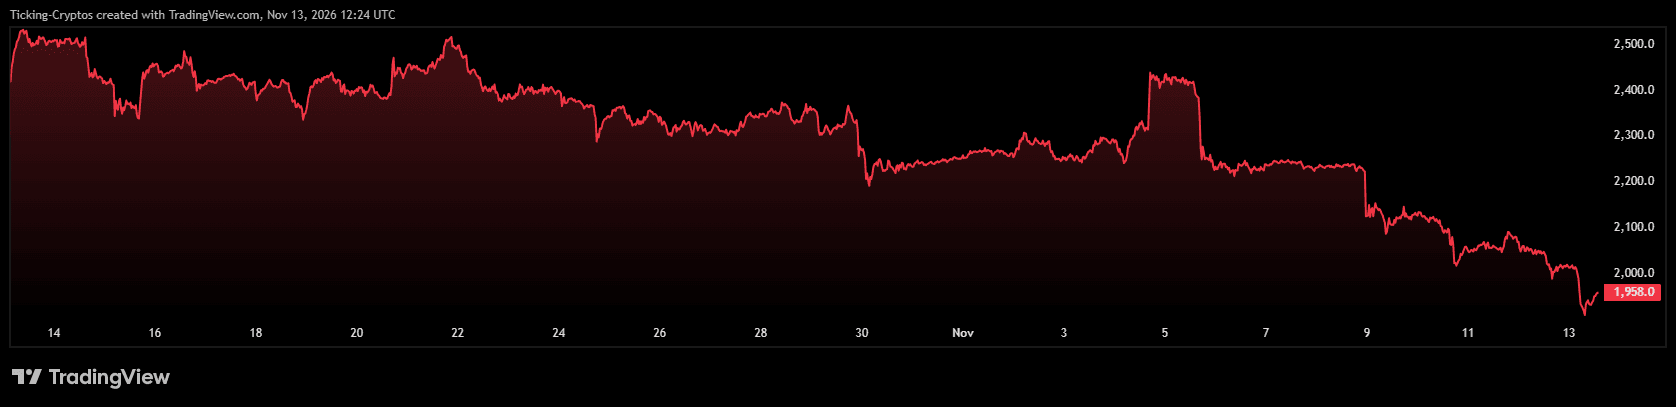
The 30-day chart tells the story in one picture. ETH started mid-October near $2,500, chopped sideways for two weeks, then broke lower at the end of the month. A squeeze on November 4 and 5 sent it back above $2,400, but sellers slammed the door almost immediately. From $2,417 on November 5, Ethereum price has dropped around 20% to today's $1,958.
Every bounce in this period has topped out lower than the one before. That pattern of lower highs and lower lows is the textbook definition of a downtrend, and it has been in place since the late-September peak near $2,800.
What Does the Ethereum Daily Chart Say?
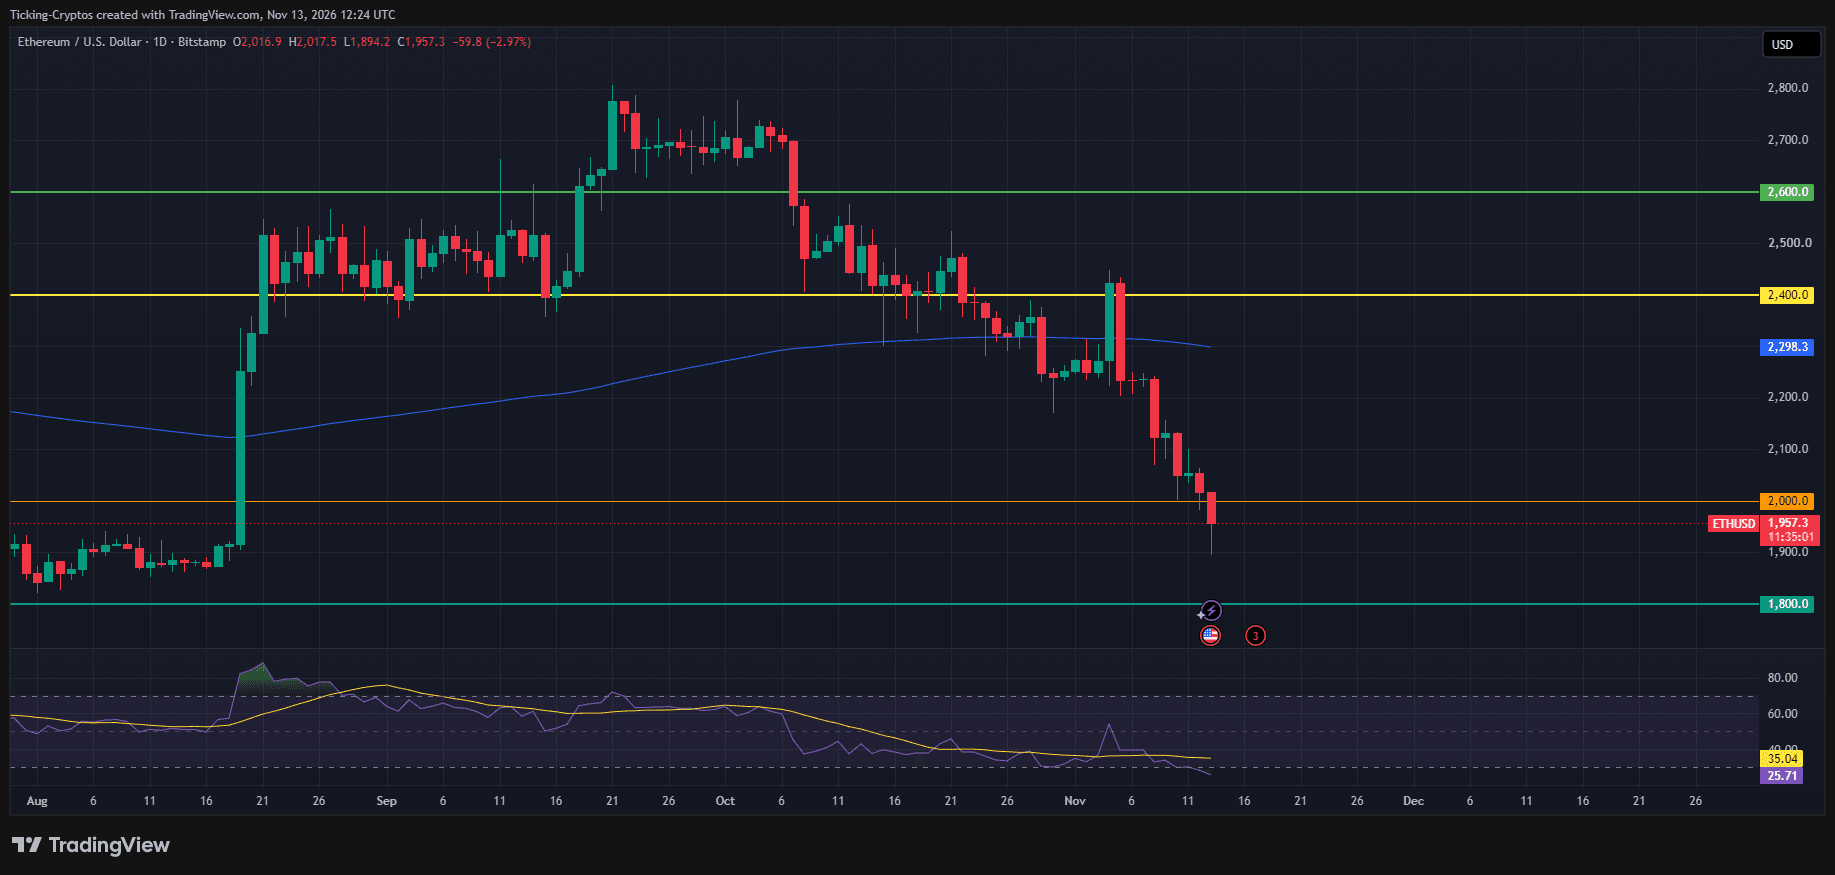
The daily chart is where the breakdown becomes obvious. Three things stand out:
- The 200-day EMA is now resistance. ETH lost the blue line around $2,300 in late October. The November 4 spike above it failed within 24 hours, which turned the 200 EMA (currently at $2,298) into a ceiling.
- $2,000 has broken. Today's candle opened at $2,016.90 and wicked down to $1,894.20. As long as price stays under $2,000 on a daily close, the psychological level flips from support to resistance.
- ETH is back where the August rally started. The massive green candle of August 19 and 20 launched from the $1,900 area. Price has now erased that entire breakout and is retesting its origin.
The daily RSI sits at 25.71, below the 30 line that marks oversold conditions and well under its signal line at 35.04. Oversold does not mean "buy" on its own: in strong downtrends, the RSI can stay pinned low for days. But readings this stretched usually come before at least a relief bounce.
Ethereum Price Analysis on the 3H Chart: Is a Relief Bounce Starting?
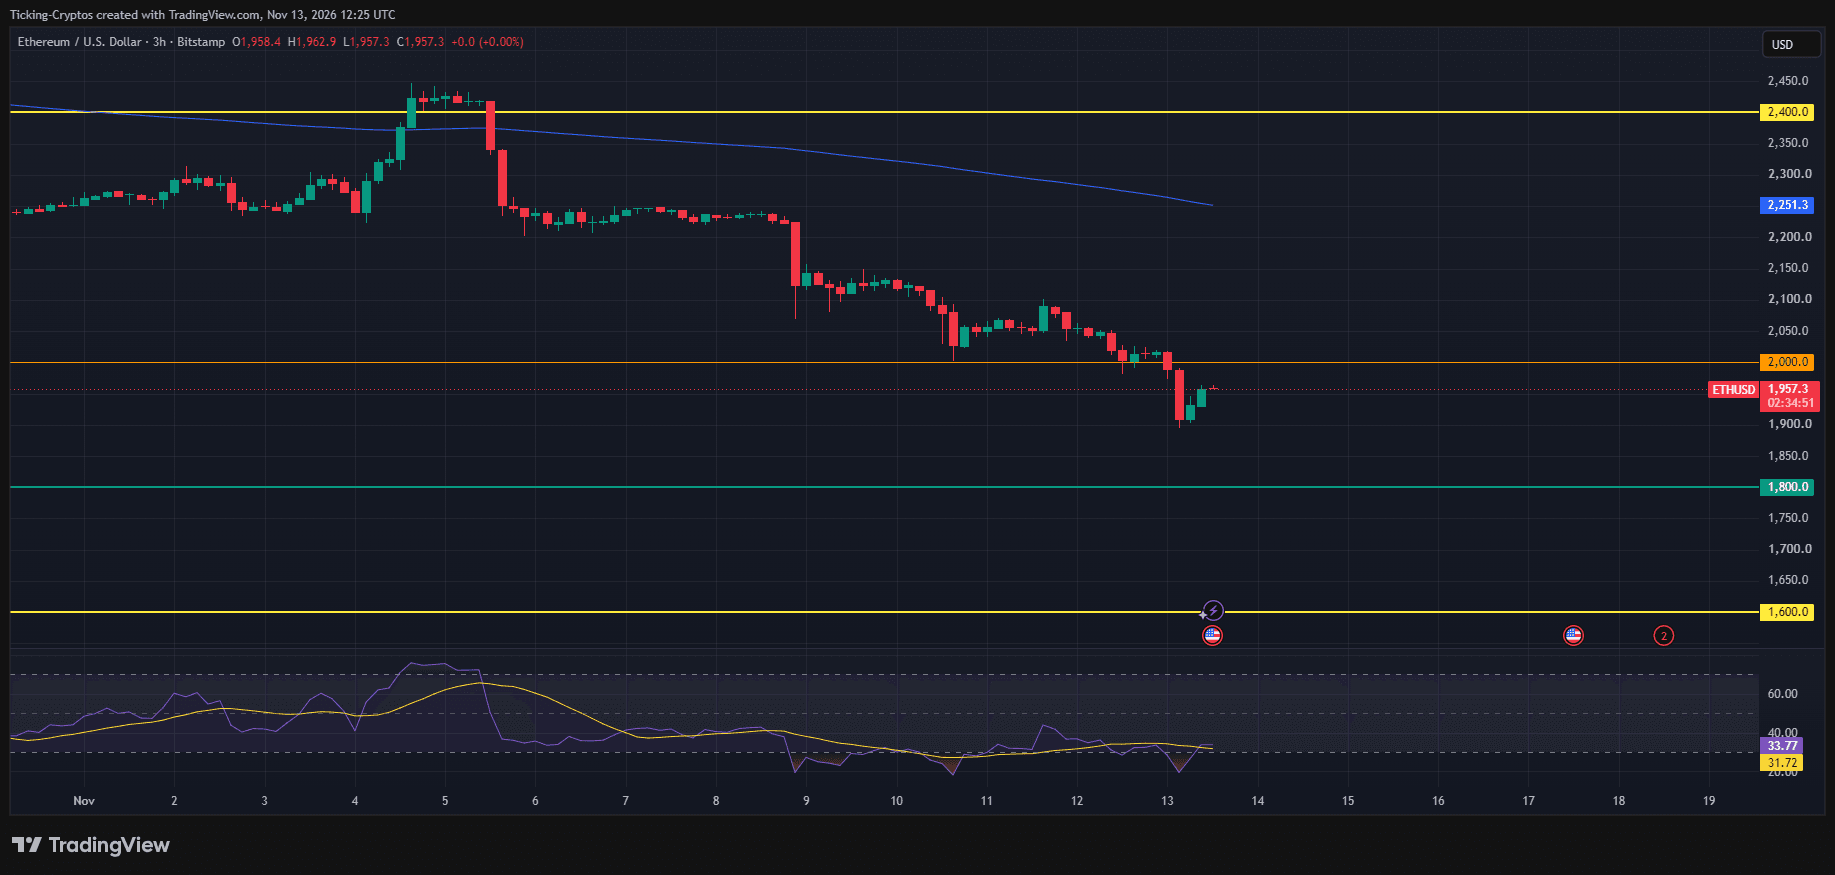
Zooming into the 3-hour chart, the first signs of stabilization are showing. After the flush to $1,894, ETH printed two green candles back toward $1,958. The 3H RSI has turned up to 33.77 and crossed above its signal line at 31.72, a small but early hint that selling momentum is fading.
The levels on this timeframe are clear:
- $2,000: broken support, now the first wall for any bounce
- $2,251: the 200 EMA on the 3H chart, the main trend filter
- $2,400: the November 5 rejection zone
- $1,800: the next major support below
- $1,600: the deeper support if $1,800 gives way
Ethereum Price Prediction: How Low Can ETH Go?
The bearish scenario kicks in if ETH fails to win back $2,000 and closes a daily candle below today's $1,894 wick. In that case, the targets are:
- Low target 1: $1,800. This is the floor of the August trading range, before the big breakout. It is the most likely magnet if selling continues, and it lines up with the green support on both charts.
- Low target 2: $1,600. If $1,800 cracks, there is little chart structure until the $1,600 zone. That would mean a drop of roughly 18% from current prices and would likely take another forced liquidation wave or a hawkish surprise from the Fed.
Ethereum Price Prediction: How High Can ETH Bounce?
The bullish scenario starts with one condition: a daily close back above $2,000. With the daily RSI this oversold, a short squeeze could unfold fast. The upside targets are:
- High target 1: $2,000 to $2,050. Reclaiming the round number would trap late shorts and is the first realistic relief target.
- High target 2: $2,250 to $2,300. The 200 EMA on the 3H chart ($2,251) and the daily 200 EMA ($2,298) form a dense resistance cluster. This is where a bounce is most likely to stall.
- High target 3: $2,400. Only a clean break above the 200-day EMA would reopen the path to the November 5 high. That would also be the first higher high since September and would end the downtrend.
Our ETH price prediction: the base case is a choppy relief bounce toward $2,000 before the market picks its next direction. As long as ETH trades below the 200-day EMA, every rally remains a bounce inside a downtrend, not a reversal. Track the Ethereum price today and the longer-term outlook on our Ethereum price prediction page.
What Should ETH Traders Watch Next?
- US PPI data: producer prices are due today at 13:30 GMT. Another hot print would cement the December hike odds and weigh on risk assets.
- Ethereum ETF flows: a first day of net inflows would be the earliest sign that institutions are stepping back in.
- Bitcoin at $70,000: ETH rarely bottoms while Bitcoin is still falling. A reclaim of $70,000 would take a lot of pressure off altcoins.
- Funding and liquidations: after two big long flushes, leverage is lighter. If shorts pile in too aggressively, the setup for a squeeze improves.
Bottom line: the Ethereum crash below $2,000 broke a key level, but the charts also show a market that is stretched to the downside. Watch $1,800 below and $2,000 above. Whichever breaks first will likely decide the next big move.
0
0

 Manage all your crypto, NFT and DeFi from one place
Securely connect the portfolio you’re using to start.
 Where will Ethereum trade next?
Live Polymarket and Kalshi odds on Ethereum price targets, compared side by side.
See Ethereum price odds


