
Dogecoin Price Prediction: Why DOGE Fell 4.2% After DogecoinVM News?

0
0

A new report says Dogecoin transactions could run up to 300 times faster, yet the price has fallen 4.2% in a day. This Dogecoin price prediction starts with that gap between technology news and market reaction.
Dogecoin started in 2013 as a light-hearted take on crypto, built around the Shiba Inu meme.
It has since become one of the largest digital assets by value, and the Dogecoin coin keeps a large community of holders.
The Dogecoin price today is $0.0849, down 4.2% over the past 24 hours. The coin has traded between $0.08119 and $0.08872, and its market cap stands at $13.266 billion.
That places it 12th by rank. Anyone searching for a Dogecoin price prediction 2026 outlook will notice that the price sits near the bottom of its daily range.
Current Dogecoin (DOGE) Market Data
Metric | Value |
Price | $0.0849 |
24h Change | -4.2% |
24h Range | $0.08119 to $0.08872 |
Market Cap | $13.266 billion |
Market Cap Rank | #12 |
Source: market data taken from CoinGecko, as of Oct 9, 2026. Figures may vary slightly across other tracking websites.
Dogecoin (DOGE) News Today
The latest Dogecoin news comes from BSCN Newswire. It reports that fintech firm Metallicus has launched an alpha version of DogecoinVM on the mainnet of its Metal Blockchain.
Metallicus says this makes DOGE transactions up to 300 times faster.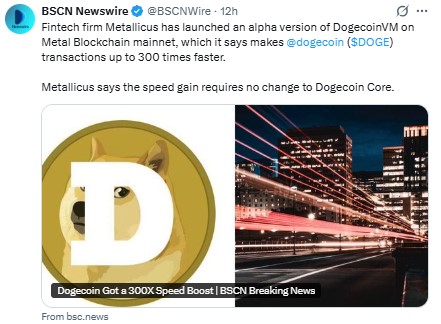
Source: Data Taken From @BSCNews X Account
The company also says the speed gain needs no change to Dogecoin Core. The release is an alpha version, and the speed claim comes from the company itself, so we could not verify it.
Wallets, merchants, and exchanges would need to adopt it before it affects demand. The price has fallen over the past day, so the market has not yet reacted positively.
Dogecoin Technical Analysis
The daily chart shows DOGE inside a symmetrical triangle. A falling trendline from the late September high forms the upper side, and a rising trendline from the mid-September low forms the lower side. 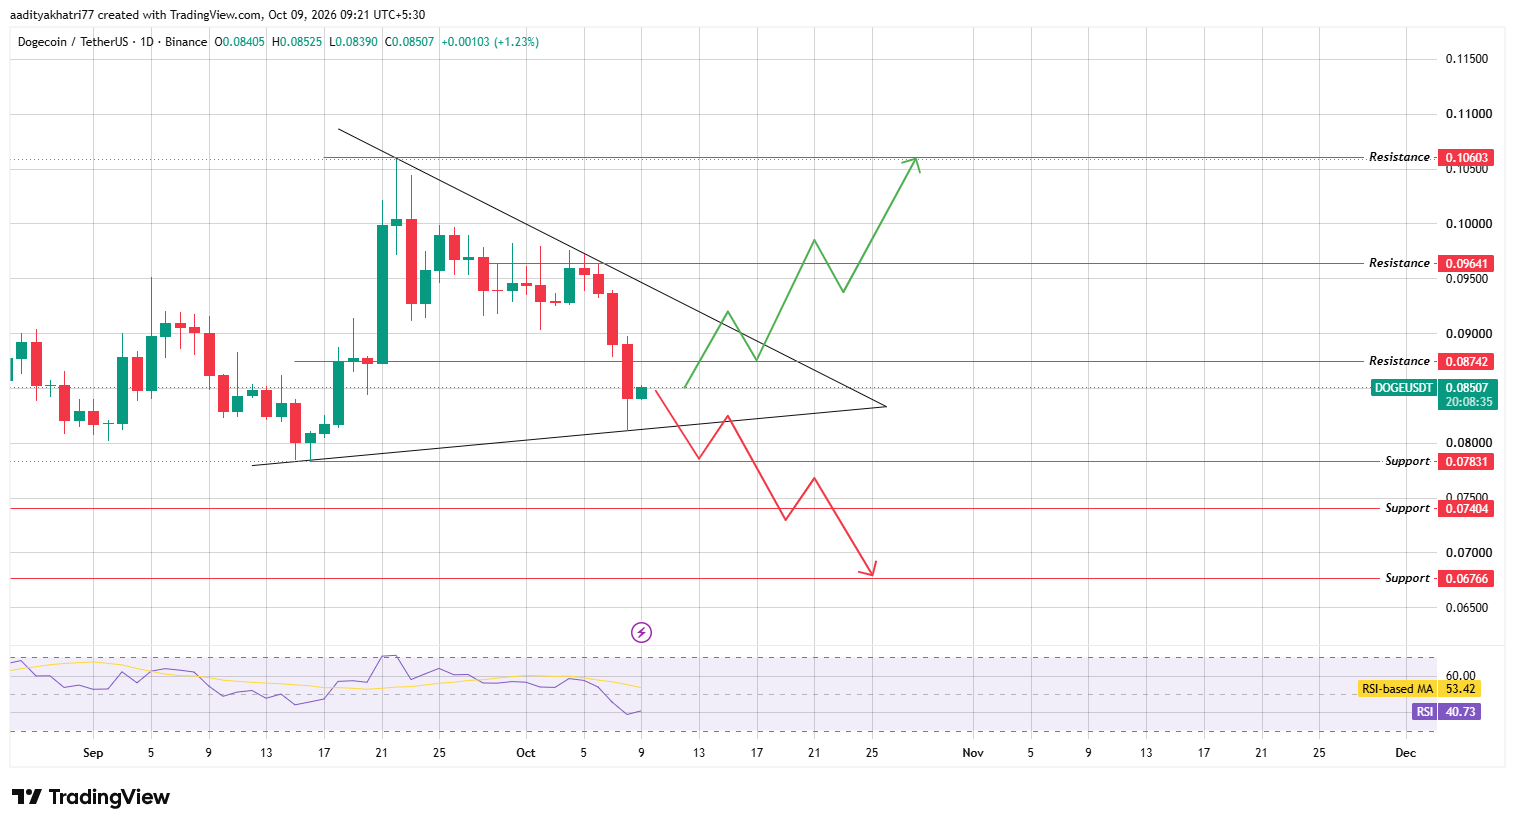
Source: TradingView, DOGE/USDT daily chart, Binance, October 9, 2026
The two lines meet in late October, so a decisive move is likely before then. $DOGE trades near 0.08507 on Binance after a sharp drop on October 8. The rising trendline held on that drop.
The current daily candle is up 1.23% and is due to close at 05:30 IST on October 10, which is 00:00 UTC.
The RSI stands at 40.73, below its moving average of 53.42. Momentum is weak, but the reading is not oversold. Our Dogecoin technical analysis therefore waits for price and volume to confirm the next move.
Dogecoin Price Prediction: Can DOGE Break Out of the Triangle?
The bullish case starts with resistance at 0.08742, about 2.8% above the 0.08507 chart price. A daily close above it, on volume higher than the 20-day average, would be the first confirmation.
The next step is a daily close above the falling trendline of the triangle. That line sits above 0.08742 and slopes lower each day, so the breakout level keeps falling. A close above it on strong volume would signal that buyers have taken control.
If both breaks hold, the chart points to 0.09641, about 13.3% higher. A further advance would target 0.10603, roughly 24.6% above the chart price. That level matches the late September high.
What Happens to DOGE If the Triangle Breaks Down?
The bearish case begins with a daily close below the rising trendline, with sell volume above the 20-day average. That would end the series of higher lows that has formed since mid-September.
The next step is a daily close below support at 0.07831, about 7.9% under the chart price. That level matches the mid-September low. A confirmed break would open the way to 0.07404, roughly 13.0% lower.
The final support on the chart is 0.06766, a fall of about 20.5%. The weak RSI adds to the caution, since it has not yet turned up.
Price Levels to Watch
These levels come from the daily chart and are judged on closing prices.
Support | Resistance |
0.07831 | 0.08742 |
0.07404 | 0.09641 |
0.06766 | 0.10603 |
Bull, Base, and Bear Scenarios
Scenario | Setup | Level |
Bull | Daily close above resistance, then above the falling trendline, on above-average volume | 0.09641 to 0.10603 |
Base | Price stays inside the triangle between the two trendlines. | 0.07831 to 0.08742 |
Bear | Daily close below the rising trendline, then below support, on rising volume | 0.07404 to 0.06766 |
Dogecoin vs Bitcoin
$DOGE fell 4.2% against the dollar and 3.5% against Bitcoin over 24 hours. Simple arithmetic shows that Bitcoin lost under 1% in dollar terms.
$DOGE therefore fell far more sharply than the largest crypto asset. That gap is common for meme coins, which tend to move more than Bitcoin in both directions.
A steady Bitcoin would help DOGE defend the rising trendline. A deeper Bitcoin drop would likely pull it toward 0.07831.
Methodology
This Dogecoin price prediction uses three inputs. The levels, the symmetrical triangle, and the RSI come from the daily Binance DOGE/USDT chart on TradingView, captured at 09:21 IST on October 9, 2026.
Market data comes from a CoinGecko snapshot. The news item comes from a BSCN Newswire post.
The chart price of 0.08507 differs slightly from the CoinGecko price of 0.0849. The two sources use different exchange data and different time windows.
The chart candle is up 1.23% since 00:00 UTC, while CoinGecko shows a rolling 24-hour fall of 4.2%. We use the chart price for percentage distances and the CoinGecko price for the headline figure.
We accept a breakout or breakdown only on a closed daily candle, with volume above the 20-day average.
That average is our own confirmation standard and does not come from the chart. No liquidation or exchange volume data was available, so neither is used.
Expert Opinion
General market commentary on symmetrical triangles holds that they show a squeeze, not a direction. The price moves in a narrowing range until a close beyond one trendline decides the outcome.
The same commentary warns that early breaks often fail without volume. For DOGE, a daily close above 0.08742 and the falling trendline would favor buyers.
A close below the rising trendline would favor sellers. Network upgrades can lift sentiment, yet price tends to follow adoption and demand.
Disclaimer: This article is for information only and is not financial advice. DOGE is a volatile meme asset, and its price can fall below every support level listed here. A loss of the full amount invested is possible. Technical levels can fail, and no scenario above has a guaranteed probability. Please research independently and invest only what you can afford to lose.
0
0


 Manage all your crypto, NFT and DeFi from one place
Securely connect the portfolio you’re using to start.


