
Ethereum Leverage on Binance Hits 5-Month High as ETH Tops $2,400

0
0

Ethereum is trading near $2,426, up 5.79% (+$132.78) in 24 hours. Buyers now face resistance at $2,450 to $2,550, with $3,000 as the main target if momentum holds.
The setup got more interesting after Binance's estimated leverage ratio hit about 0.8162. That is its highest level in five months, based on CryptoQuant data. 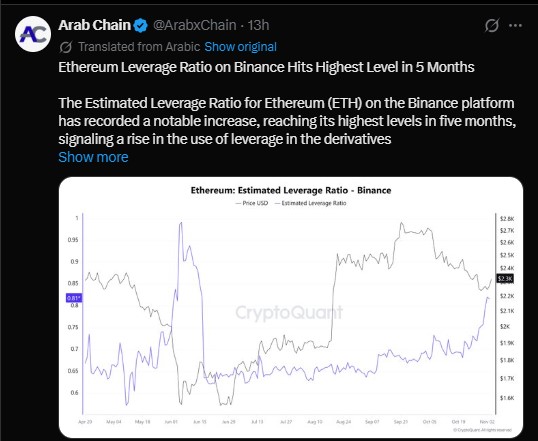
Midterm Rally Sets the Stage
Risk assets rallied after the US midterms. Reports say Democrats won both the House and the Senate.
Bitcoin swept its local lows and bounced back above $80,000. That suggests traders are taking on risk again.
Analyst Matt Hougan noted that election-linked tokens like TRUMP and WLFI got hit, while BTC, ETH, and SOL held up.
ETH bounced from $2,226 and printed a strong momentum candle. After a long downtrend, that is an early reversal sign. It is not confirmation.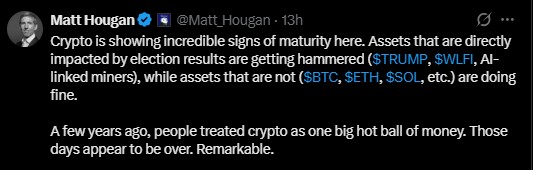
ETF Inflows Support the Bull Case
US spot ETH ETFs saw $53.02 million in net inflows on November 4. Cumulative inflows now total $12.12 billion.
Net assets stand at $14.12 billion, or 4.77% of ETH's market cap. If inflows continue, they could help buyers push through resistance.
Fund | Issuer | Daily Net Flow (Nov 4) |
ETHA | BlackRock | +$32.75M |
FETH | Fidelity | +$19.24M |
ETH | Grayscale | +$13.60M |
ETHE | Grayscale | +$9.68M |
ETHB | BlackRock | -$22.38M |
Source: SoSoValue
BlackRock's ETHB lost $22.38 million, so flows were mixed.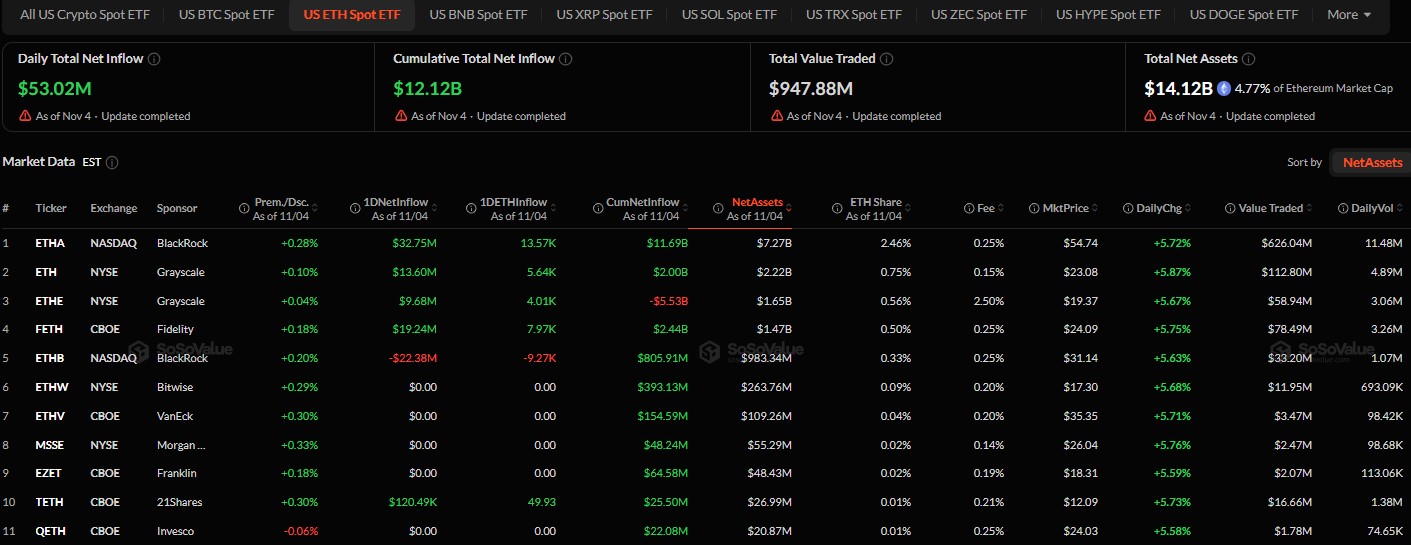
Leverage Raises the Stakes
Higher leverage means more traders are using borrowed money. The ratio does not show if they are long or short.
Derivatives data shows heavy activity. Futures volume rose 60.80% to $58.19 billion. Open interest gained 5.82% to $30.10 billion.
The overall long/short ratio is 0.8748, which leans short. Yet Binance top trader accounts sit at 1.4498, which leans long.
Liquidations reached $209.05 million in 24 hours. Shorts lost about $126.16 million, and longs lost $82.90 million.
A short squeeze may be helping the move higher.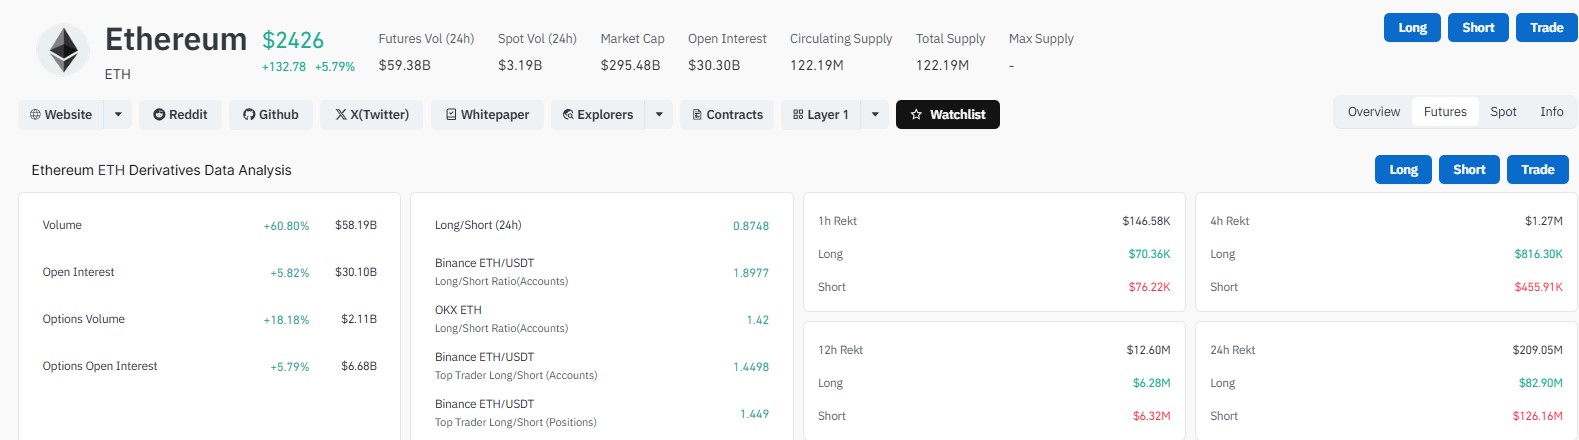
ETH Price Outlook: Key Levels and Scenarios
Ethereum is forming a pennant pattern on the hourly chart. A breakout from it should set the next trend. The nearest resistance is $2,450 to $2,550, about 1% to 5% above the current price.
A daily close above it would put $3,000 in view, roughly 24% higher. Support sits at $2,226, about 8% below.
Scenario | What Needs to Happen | Level in Focus |
Bullish | Clean break above resistance with steady ETF inflows | $3,000 |
Neutral | Choppy trade inside the range | $2,226 to $2,550 |
Bearish | Rejection at resistance, then a break below the bounce low | Below $2,226 |
Dominance Chart Hints at a Shift
Trader Tardigrade sees an inverse head and shoulders on the weekly ETH dominance chart. The right shoulder looks complete. A bullish candle followed a hammer.
A neckline break would confirm the pattern. That could favor Ethereum against the broader market, but it is not a sure thing.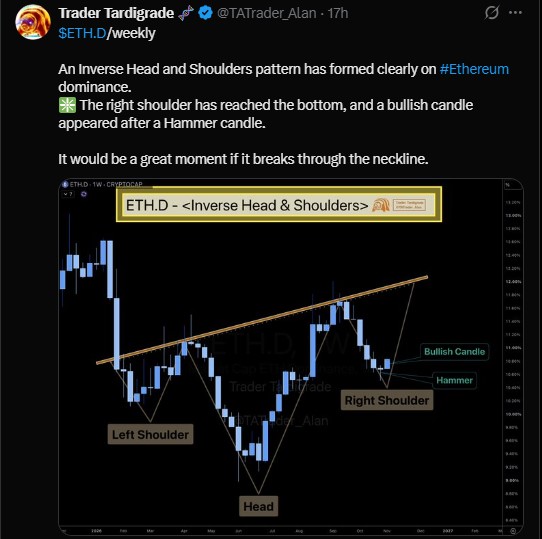
Long-Term View: Can ETH Retest $4,811.71?
Analyst Javon Marks sees a possible move of nearly 100% back to $4,811.71. He says a break above could bring $8,500 into play.
That is a big call for Ethereum, which first has to clear $3,000. Every step comes with risk.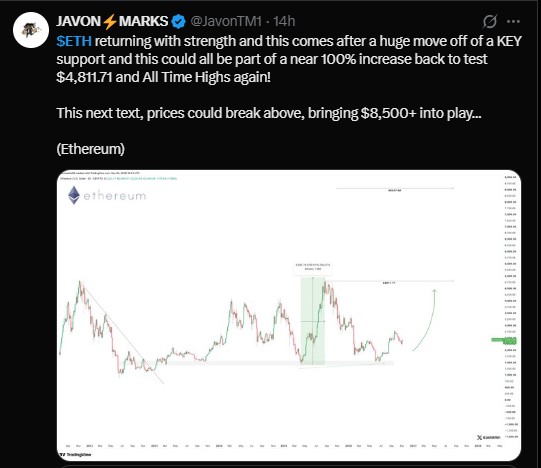
Risks to the Outlook
Rejection near $2,550 could send ETH back toward $2,226. A drop under it would weaken the reversal case.
Crowded leverage can speed up losses too. Ethereum could see sharper swings if leverage keeps building.
Traders may want to watch ETF flows, open interest, and liquidations. Nothing here is certain.
Disclaimer
This article is for information only and is not financial, investment, or trading advice. Cryptocurrency prices are volatile, and you can lose some or all of your money. Price levels and views mentioned here are not guaranteed outcomes. Always do your own research and speak with a licensed financial advisor before making any investment decision.
0
0


 Manage all your crypto, NFT and DeFi from one place
Securely connect the portfolio you’re using to start.
 Where will Ethereum trade next?
Live Polymarket and Kalshi odds on Ethereum price targets, compared side by side.
See Ethereum price odds


